
Finding performance problems and bottlenecks on a Mac system no longer needs to be a complicated task. Performance Probe makes it easy.
What is Performance Probe for Mac OS X?
Are you running out of memory when you use your system? Is
there an application that's using too much CPU power? Is an
application bottlenecking your I/O, slowing everything down? Is
there an application that's accessing memory so often nothing
else has a chance to run quickly? How can you find out?
One way to find out is by using Activity Monitor, which is
included in the OS. We have a write up on it in our How-To
section. The problem with Activity Monitor, which is a great
tool, is that it needs almost a full screen to use, and load
monitoring can be difficult.This is where Performance Probe
comes in.
The new version of Performance Probe not only provides
dynamically updated parameters such as memory, drive space, and
VM parameters, its new heads up display, or HUD, can be used to
get a quick snapshot of the top CPU and memory consumers,
provide configurable load monitoring, and graphically depict
drive I/O and network loading.
Read the text underneath the screen captures below to see what Performance
Probe is capable of!
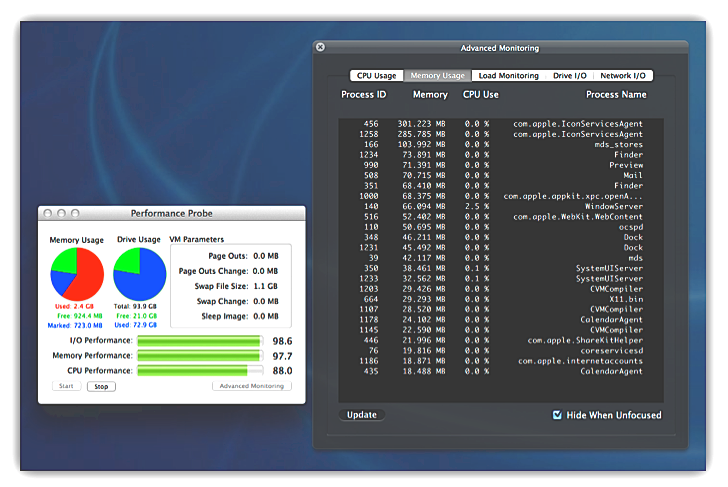
Performance Probe has two components, the basic
interface, shown on the left, and the HUD shown on the right.
The HUD is translucent and can be configured to remain visible
at all times or come up only when the user clicks on Performance
Probe to make it the foreground application. The HUD
display can continue monitoring data even when hidden, allowing
the user to make it visible on demand when they want to know
what's going on with their system. The HUD can get quick
snapshots of memory and CPU usage, and constantly monitor
system, drive, and network loading.
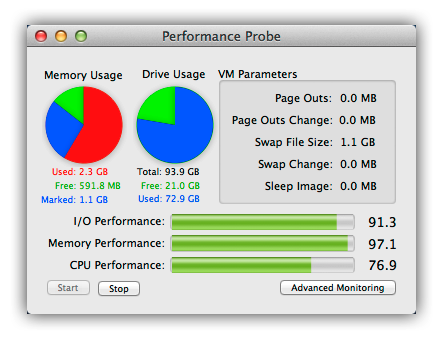
The basic user interface is reasonably small, being 389 by 267
pixels. The HUD is brought up by clicking on the "Advanced
Monitoring" button in the lower right corner. The rest of the
information on the basic user interface can give you an overview
of how heavily loaded the system is. The three bar indicators
indicate how heavily the system is being hit by applications.
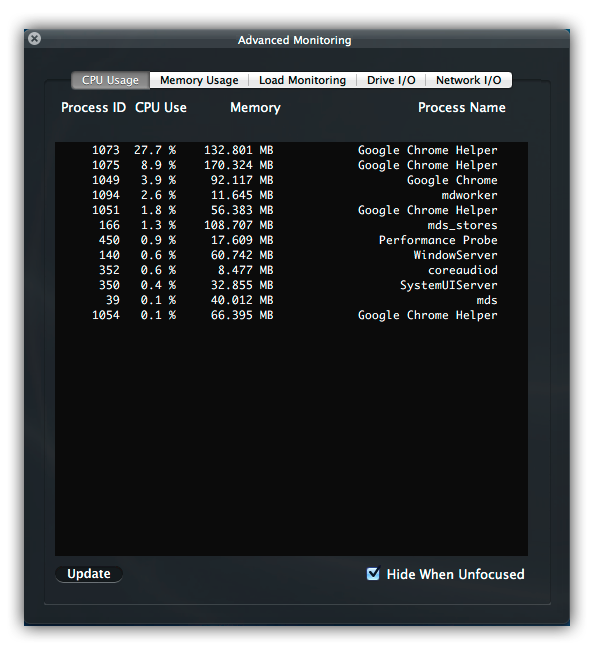
The HUD display is a tabbed display. The CPU Usage option, shown above, shows a quick snapshot of applications currently using the system by CPU power in descending order. It deliberately excludes applications that aren't active allowing you to focus on what's really consuming CPU power.
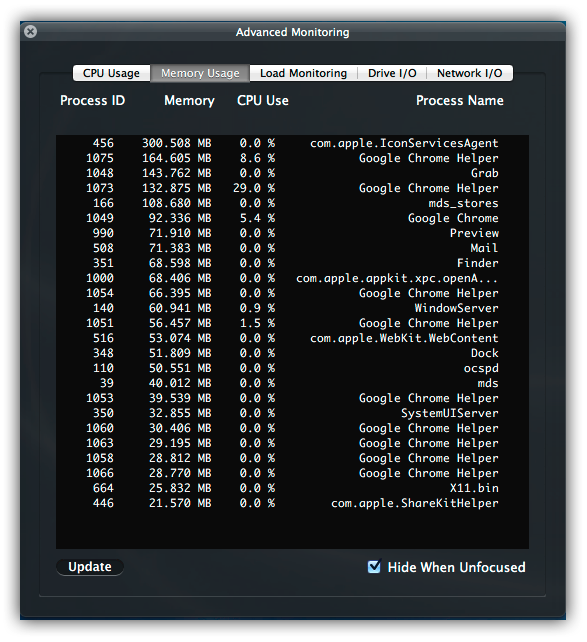
The Memory Usage option shown above, shows a quick snapshot of the top memory consumers using the system. You can manually update it by clicking on the "Update" button in the lower left corner.
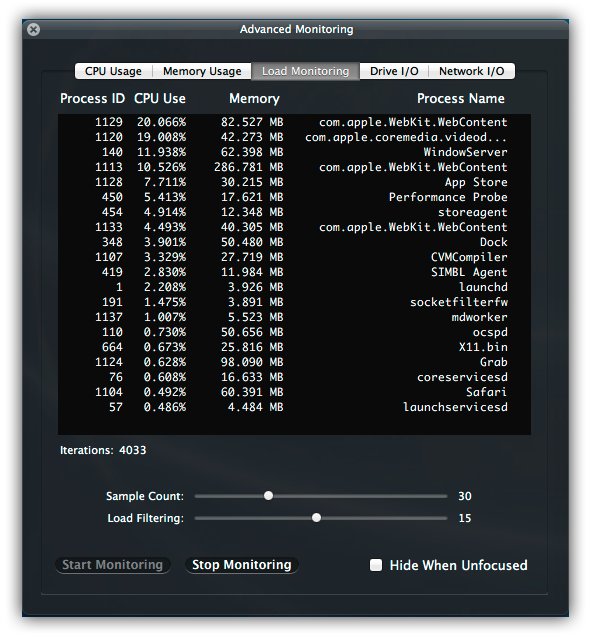
The Load Monitoring option, will, once started, start
monitoring and averaging load. Instead of seeing lots of
processes jumping around, making it difficult to tell exactly
which process is responsible for problems, this will narrow it
down for you. It's fully configurable, and will remain running
even if the HUD is hidden!
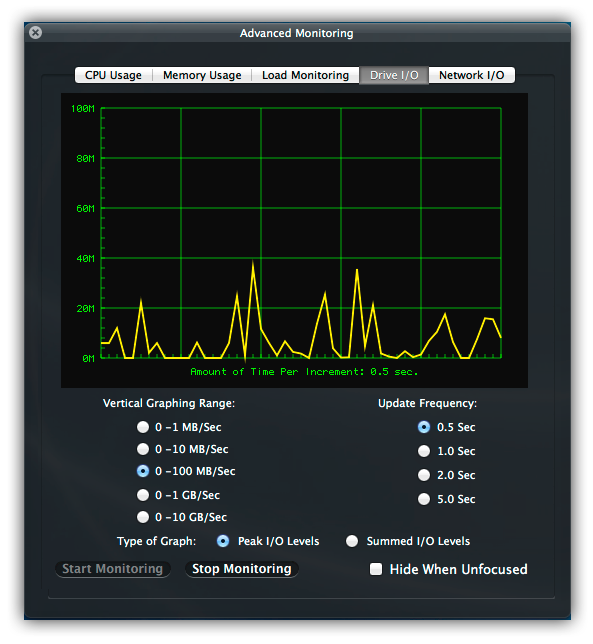
The Drive I/O option, will, once started, start monitoring the
peak or summed amounts of drive activity going on with your
system. Once monitoring is enabled, you can change the graphing
ranges, update frequencies, and the type of graph to display as
you see fit. Monitoring will continue even if the HUD display is
hidden and will expose updated information when brought to the
foreground.
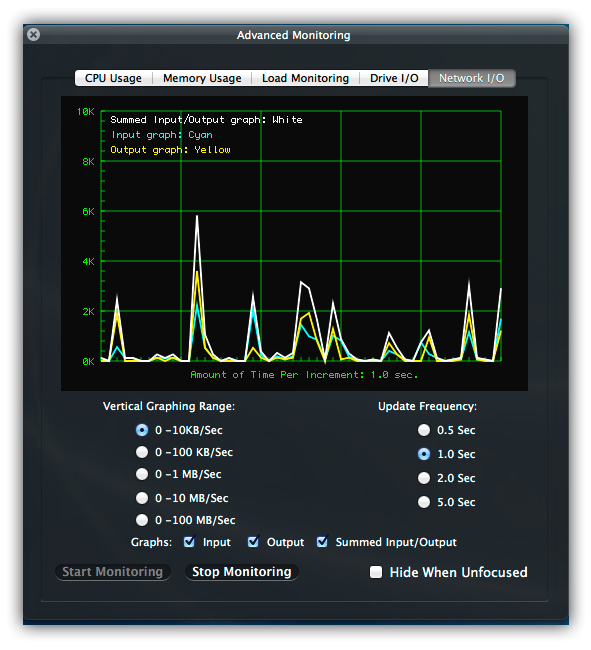
The Network I/O option, will, once started, start monitoring
the input, output, and summed amounts of network activity. Once
monitoring is enabled, you can change the graphing ranges,
update frequencies, and show any or all of the I/O activity as
you see fit. In the shot above, we're showing all three graphs
active. As with both load monitoring and drive I/O, network
monitoring will continue even if the HUD display is hidden, and
will expose updated data when brought to the foreground.
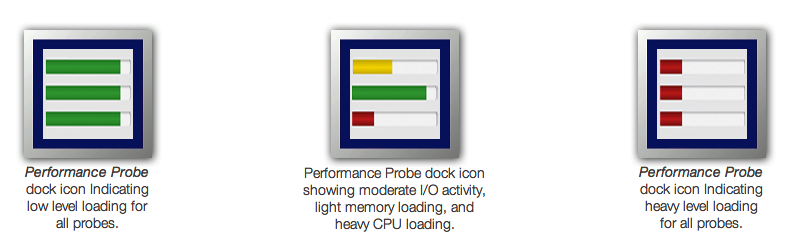
An Active Icon Makes Monitoring Easy and Frees up Desktop Space
Performance Probe uses an active icon. If you minimize
(iconize) the application while it’s active, the application
will update the dock icon to give you a general idea of how the
system is being loaded. If the system gets “hot” and starts
showing too much activity, just click on the icon in the dock
and view Performance Probe as well as the HUD display as
needed.
System Requirements
Performance Probe supports MacOS® versions 10.6 (Snow
Leopard), 10.7(Lion), 10.8 (Mountain Lion), 10.9
(Mavericks), 10.10 (Yosemite), 10.11 (El Capitan), and 10.12
(Sierra) on Intel platforms. Supported Intel based systems
include all variants of the MacBook, MacBook Air, MacBook Pro,
iMac, Mac Pro, and Mac Mini.
Drive I/O measurements are limited to a total of 16 connected
drives.
Performance Probe requires administrative access.
Purchasing Performance Probe
To purchase Performance Probe click on the Buy
Performance Probe button below. Performance Probe
can be purchased as a standalone product or bundled with Scannerz
with FSE or Scannerz with FSE-Lite.
Prices:
$14.95 For the Performance Probe Standalone package
$34.95 For Scannerz with Performance Probe, Phoenix and
FSE-Lite
$44.95 For a Scannerz with Performance Probe, Phoenix and
FSE combined bundle (save $9.95)


